BENCHMARKING RESULTS FOR RiPP IDENTIFICATION
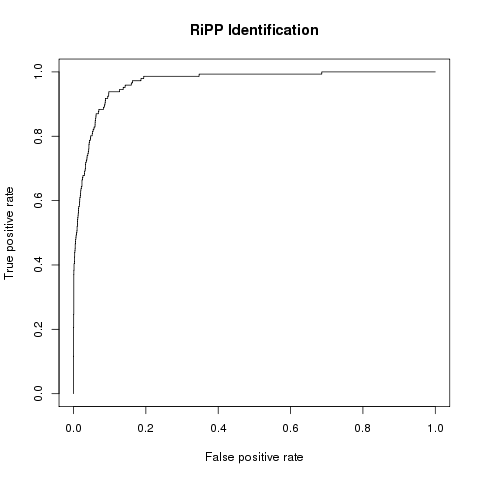
Method: Support Vector Machine (SVM)
| Sensitivity | Specificity | Precision | MCC | AUC |
| 0.94 | 0.90 | 0.90 | 0.85 | 0.97 |
BENCHMARKING RESULTS FOR RiPP CLASS PREDICTION
MultiClass SVM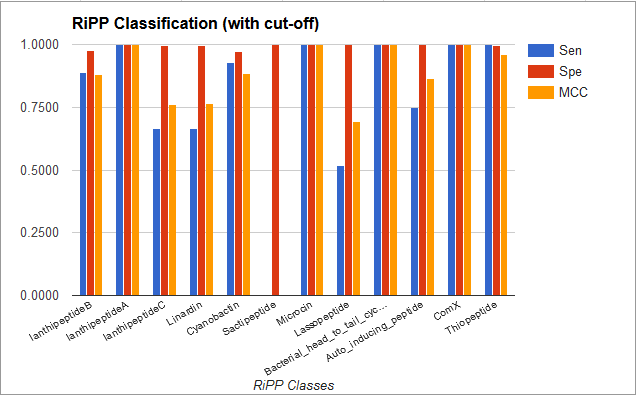
| Class | Sensitivity | Specificity | MCC |
| LanthippeptideB | 0.89 | 0.98 | 0.88 |
| LanthippeptideA | 1.00 | 1.00 | 1.00 |
| LanthipeptideC | 0.67 | 0.99 | 0.76 |
| Linaridin | 0.67 | 0.99 | 0.77 |
| Cyanobactin | 0.93 | 0.97 | 0.88 |
| Sactipeptide | 0.00 | 1.00 | 0.00 |
| Microcin | 1.00 | 1.00 | 1.00 |
| Lassopeptide | 0.51 | 1.00 | 0.69 |
| Bacterial Head-to-Tail Cyclized Peptide | 1 | 1 | 1 |
| Auto Inducing Peptide | 0.75 | 1 | 0.86 |
| ComX | 1.00 | 1.00 | 1.00 |
| Thiopeptide | 1.00 | 0.99 | 0.96 |
Average Sensitivity is 0.78, Specificity is 0.99 and MCC is 0.82
BENCHMARKING RESULTS FOR LANTHIPEPTIDE CLEAVAGE PREDICTION
| Total | Positive Set | Negative Set# | Sensitivity | Specificity | Precision | MCC |
| 2314 | 52 | 2262 | 0.71 | 0.99 | 0.69 | 0.69 |
#Note: The 'cost factor' has been used while training the classifier to adjust the diffrences
in counts of positive and negative datasets
BENCHMARKING RESULTS FOR LANTHIPEPTIDE CROSSLINKS PREDICTION
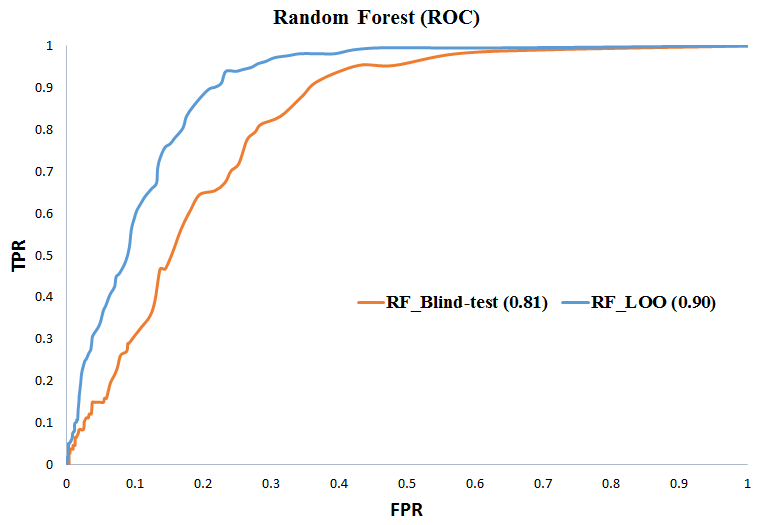 Method: Random Forest (RF)
View Comparison of Predicted Crosslinks with Actual Structure for Lanthipeptides
| Total | Positive Set | Negative Set# | Sensitivity | Specificity | Precision | MCC |
| 1576 | 218 | 1358 | 0.72 | 0.95 | 0.73 | 0.68 |
#Note: The 'cost factor' has been used while training the classifier to adjust the diffrences
in counts of positive and negative datasets
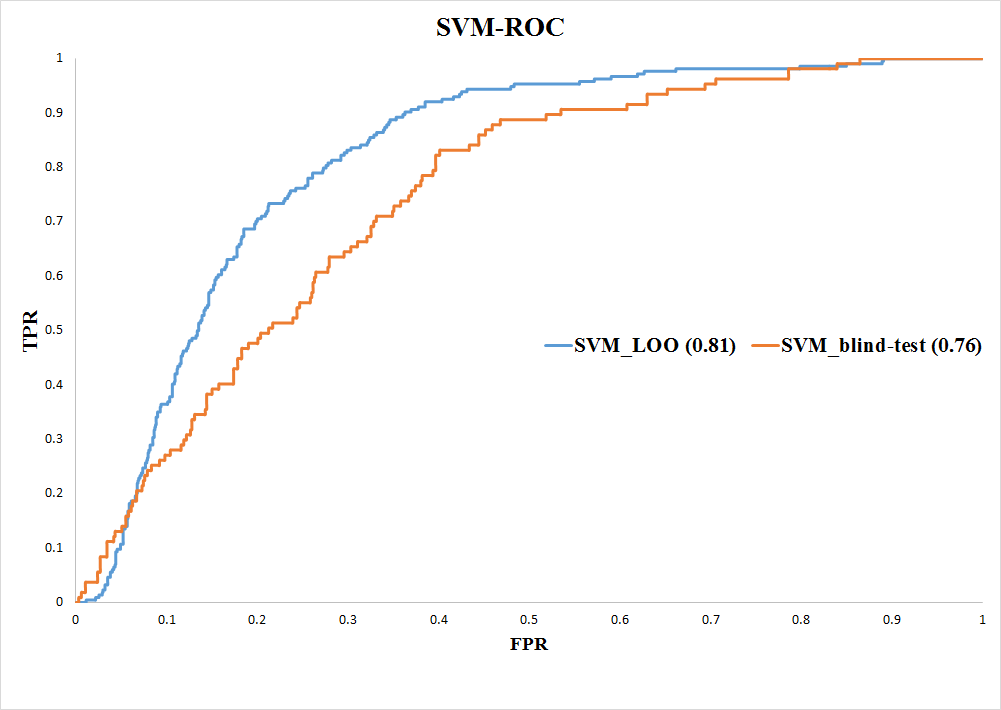 Method: Supoort Vector Machine (SVM)
| Total | Positive Set | Negative Set# | Sensitivity | Specificity | Precision | MCC |
| 1576 | 218 | 1358 | 0.57 | 0.94 | 0.63 | 0.54 |
#Note: The 'cost factor' has been used while training the classifier to adjust the diffrences
in counts of positive and negative datasets
BENCHMARKING RESULTS FOR LASSOPEPTIDE CLEAVAGE & CROSSLINKS PREDICTION
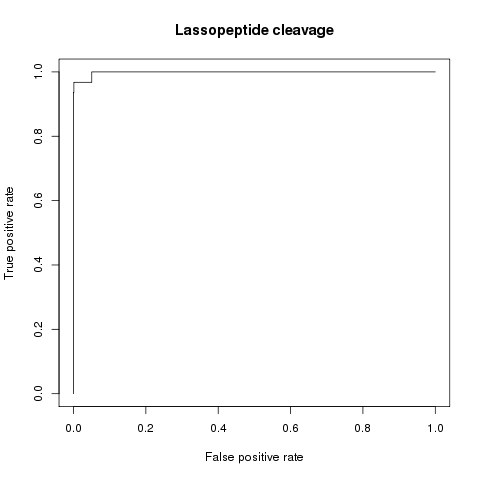 Cleavage site Prediction AUC = 0.998
CrossLinks
| Total sequences | Correct prediction in top rank | Correct prediction in top 2 rank |
| 60 | 50(83.33%) | 55(91.67%) |
BENCHMARKING RESULTS FOR CYANOBACTINS CLEAVAGE & CROSSLINKS PREDICTION
1. Core peptide predictionTwo SVM Classifiers were used, one each for RSII and RSIII.
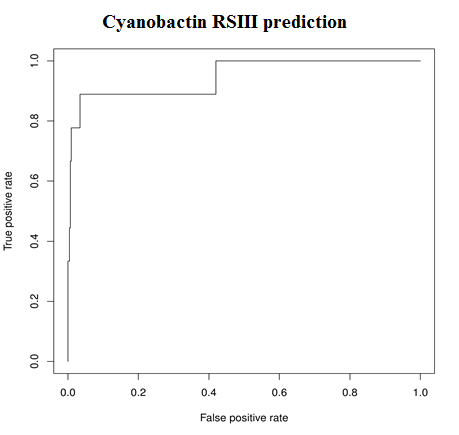
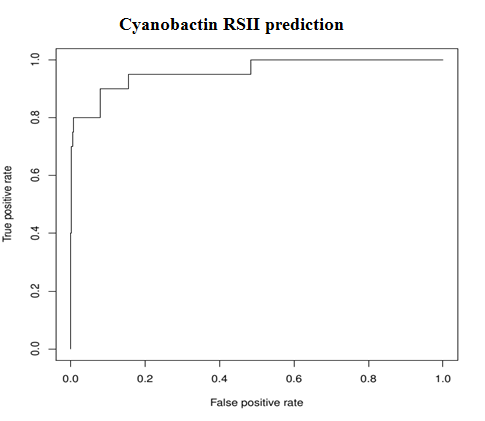
| Model | AUC |
| RSII Predictor | 0.96 |
| RSIII | 0.95 |
2. Prediction of heterocycle rings
| Total Fragments | 28 |
| Positives (With Heterocycles) | 21 |
| Positives (Without Heterocycles) | 7 |
| AUC | 1 |
BENCHMARKING RESULTS FOR THIOPEPTIDE CROSSLINK PREDICTION
| Total Sequences | 35 |
| Correct Prediction | 28 |
| Incorrect Prediction | 07 |
| Accuracy | 80% |